Getting Started Guide
Learn how to create a Hello World Logisland app. This guide covers:
-
Bootstrapping an application
-
Inject some logs
-
Parse them
-
Inspect the resulting events
1. Prerequisites
To complete this guide, you need:
-
less than 15 minutes
-
a simple text editor
-
docker & docker-compose installed and running
2. Architecture
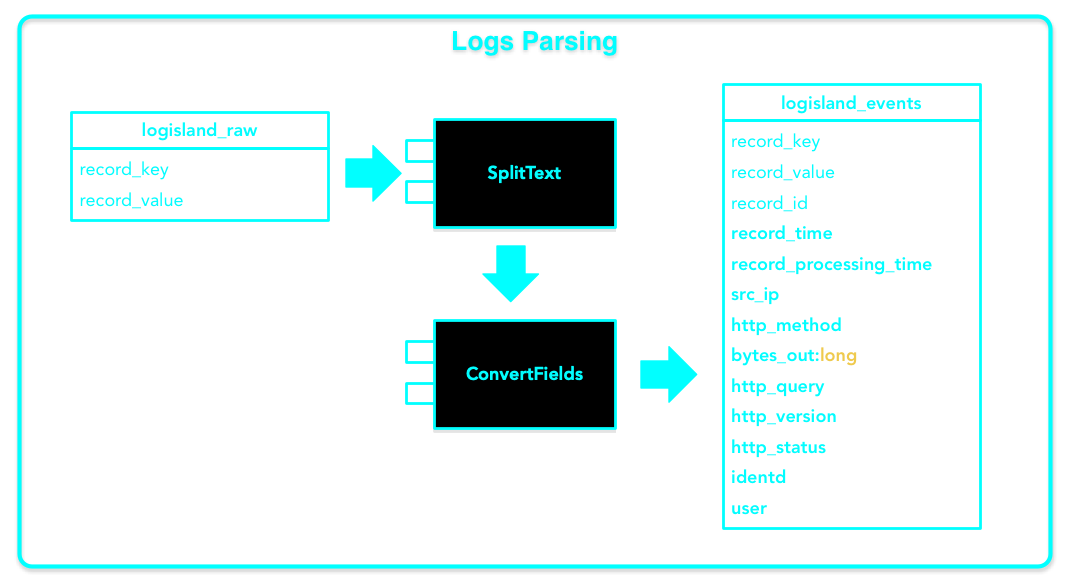
In this guide, we create a straightforward application parsing apache logs with a regex from logisland_raw topic and send structured events to logisland_events

This guide also covers the testing kafka access .
3. Solution
We recommend that you follow the instructions in the next sections and create the application step by step. However, you can go right to the completed example.
Clone the Git repository: git clone https://github.com/hurence/logisland-quickstarts.git, or download an archive.
The solution is located in the conf/core/parse-apache-logs.yml file.
4. Boostraping Logisland
Our app is pretty straightforward, it reads some raw apache log lines from a kafka topic, parse these lines as Logisland Records and send these records to another Kafka topic.
4.1. Configure the streaming app
The easiest way to create a new Logisland project is to open a text editor in the conf/core folder and to edit a config file.
Edit the following content of conf/core/parse-apache-logs.yml in any text editor if you want to make some adjustments.
version: 1.1.2
documentation: LogIsland analytics main config file. Put here every engine or component config

engine:
  component: com.hurence.logisland.engine.spark.KafkaStreamProcessingEngine
  configuration:
    spark.app.name: GettingStarted
    spark.master: local[4]
    spark.driver.memory: 2G
    spark.streaming.batchDuration: 200
    spark.streaming.kafka.maxRatePerPartition: 3000
    spark.streaming.timeout: -1
    spark.ui.port: 4050
  streamConfigurations:

    - stream: parsing_stream
      component: com.hurence.logisland.stream.spark.KafkaRecordStreamParallelProcessing
      configuration:
        kafka.input.topics: logisland_raw
        kafka.output.topics: logisland_events
        kafka.error.topics: logisland_errors
        kafka.input.topics.serializer: none
        kafka.output.topics.serializer: com.hurence.logisland.serializer.JsonSerializer
        kafka.error.topics.serializer: com.hurence.logisland.serializer.JsonSerializer
        kafka.metadata.broker.list: kafka:9092
        kafka.zookeeper.quorum: zookeeper:2181
        kafka.topic.autoCreate: true
        kafka.topic.default.partitions: 4
        kafka.topic.default.replicationFactor: 1
      processorConfigurations:

        # a parser that produce events from an apache log REGEX
        - processor: apache_parser
          component: com.hurence.logisland.processor.SplitText
          configuration:
            record.type: apache_log
            value.regex: (\S+)\s+(\S+)\s+(\S+)\s+\[([\w:\/]+\s[+\-]\d{4})\]\s+"(\S+)\s+(\S+)\s*(\S*)"\s+(\S+)\s+(\S+)
            value.fields: src_ip,identd,user,record_time,http_method,http_query,http_version,http_status,bytes_out
An Engine is needed to handle the stream processing. This configuration file defines a stream processing job setup. The first section configures the Spark engine (we will use a `KafkaStreamProcessingEngine <../plugins.html#kafkastreamprocessingengine>`_) to run in local mode with 2 cpu cores and 2G of RAM.
Inside this engine you will run a Kafka stream of processing, so we setup input/output topics and Kafka/Zookeeper hosts.
Here the stream will read all the logs sent in logisland_raw topic and push the processing output into logisland_events topic.
We can define some serializers to marshall all records from and to a topic.
5. Setting up Underlying services
Apache Kafka is pitched as a Distributed Streaming Platform. In Kafka lingo, Producers continuously generate data (streams) and Consumers are responsible for processing, storing and analysing it. Kafka Brokers are responsible for ensuring that in a distributed scenario the data can reach from Producers to Consumers without any inconsistency. A set of Kafka brokers and another piece of software called zookeeper constitute a typical Kafka deployment.
Let’s start with a single broker instance. In the core directory create your docker-compose.yml with the following content:
version: '3'
services:
  zookeeper:
    image: wurstmeister/zookeeper
    ports:
      - "2181:2181"
    networks:
      - logisland

  kafka:
    image: wurstmeister/kafka:0.10.2.1
    ports:
      - "9092:9092"
    environment:
      KAFKA_ADVERTISED_HOST_NAME: kafka
      KAFKA_CREATE_TOPICS: "test:1:1"
      KAFKA_ZOOKEEPER_CONNECT: zookeeper:2181
    volumes:
      - /var/run/docker.sock:/var/run/docker.sock
      - ./data:/tmp/data
    networks:
      - logisland

  logisland:
    image: hurence/logisland:latest
    entrypoint:
      - "tail"
      - "-f"
      - "bin/logisland.sh"
    ports:
      - '4050:4050'
    volumes:
      - ./conf:/opt/logisland/conf
    environment:
      KAFKA_HOME: /opt/kafka_2.11-0.10.2.2
      KAFKA_BROKERS: kafka:9092
      ZK_QUORUM: zookeeper:2181
      REDIS_CONNECTION: redis:6379
    networks:
      - logisland

  loggen:
    image: hurence/loggen:latest
    networks:
      - logisland
    environment:
      LOGGEN_NUM: 500
      KAFKA_BROKERS: kafka:9092

  redis:
    hostname: redis
    image: 'redis:latest'
    ports:
      - '6379:6379'
    networks:
      - logisland

volumes:
  kafka-home:

networks:
  logisland:
Start Zookeeper, Kafka, Loggen & Logisland container with the following command docker-compose up -d
6. Launch Logisland Application
Now you can run the job inside the logisland container
sudo docker exec -ti logisland-quickstarts_logisland_1 ./bin/logisland.sh --conf conf/core/parse-apache-logs.yml
This will launch a Logisland Stream application waiting for data in a Kafka topic that will be automatically created.
The last logs should be something like :
Detected spark version 2.4.0.
We'll automatically plug in engine jar /opt/logisland-1.1.2/lib/engines/logisland-engine-spark_2_3-1.1.2.jar
Listening for transport dt_socket at address: 5005
log4j:WARN No such property [datePattern] in org.apache.log4j.RollingFileAppender.
log4j:WARN File option not set for appender [rolling].
log4j:WARN Are you using FileAppender instead of ConsoleAppender?
2019-05-29 17:01:06 WARN  NativeCodeLoader:62 - Unable to load native-hadoop library for your platform... using builtin-java classes where applicable
log4j:ERROR No output stream or file set for the appender named [rolling].
2019-05-29 17:01:07 INFO  StreamProcessingRunner:43 - starting StreamProcessingRunner

██╗      ██████╗  ██████╗   ██╗███████╗██╗      █████╗ ███╗   ██╗██████╗
██║     ██╔═══██╗██╔════╝   ██║██╔════╝██║     ██╔══██╗████╗  ██║██╔══██╗
██║     ██║   ██║██║  ███╗  ██║███████╗██║     ███████║██╔██╗ ██║██║  ██║
██║     ██║   ██║██║   ██║  ██║╚════██║██║     ██╔══██║██║╚██╗██║██║  ██║
███████╗╚██████╔╝╚██████╔╝  ██║███████║███████╗██║  ██║██║ ╚████║██████╔╝
╚══════╝ ╚═════╝  ╚═════╝   ╚═╝╚══════╝╚══════╝╚═╝  ╚═╝╚═╝  ╚═══╝╚═════╝   v1.1.2
2019-03-19 16:08:47 INFO  StreamProcessingRunner:95 - awaitTermination for engine 1
2019-03-19 16:08:47 WARN  SparkContext:66 - Using an existing SparkContext; some configuration may not take effect.
7. Log mining
Now that the plumbing is up and running we’ll just see what happens.
7.1. Inject some Apache logs into Kafka
Logs are beeing sent to logisland_raw Kafka topic to simulate a log collection system. Nothing to do here as it is already done for you by the loggen container which generates random apache logs.
You could send the first 4000 lines of NASA http access over July 1995 to LogIsland with kafka scripts (available in our logisland container) to `logisland_raw` Kafka topic with the following command :
`sudo docker exec -ti logisland-quickstarts_kafka_1 sh -c "cat /tmp/data/access.log | /opt/kafka/bin/kafka-console-producer.sh --broker-list kafka:9092 --topic logisland_raw"`
If you want to see what is flowing into logisland_raw topic, just run the following :
sudo docker exec -ti logisland-quickstarts_kafka_1 /opt/kafka/bin/kafka-console-consumer.sh --bootstrap-server kafka:9092 --topic logisland_raw
It should something like
68.25.236.19 - - [19/Jun/2019:15:05:36 +0200] "GET /app/main/posts HTTP/1.0" 200 4989 "http://hunter-clark.org/main/faq.php" "Mozilla/5.0 ...
64.252.158.21 - - [19/Jun/2019:15:05:36 +0200] "POST /search/tag/list HTTP/1.0" 200 5029 "http://lambert.com/" "Mozilla/5.0 ...
77.185.192.58 - - [19/Jun/2019:15:05:36 +0200] "GET /wp-content HTTP/1.0" 200 4976 "http://simmons.com/" "Mozilla/5.0 ...
157.242.110.206 - - [19/Jun/2019:15:05:36 +0200] "DELETE /wp-content HTTP/1.0" 200 4913 "http://gonzalez-collins.com/post/" "Mozilla/5.0 ...
7.2. See what we have in return
Logisland handles the parsing of the log lines and structure them as Records before sending them to logisland_events. Those will be sent in another Kafka topic.
sudo docker exec -ti logisland-quickstarts_kafka_1 /opt/kafka/bin/kafka-console-consumer.sh --bootstrap-server kafka:9092 --topic logisland_events
You should see the apache log events such as :
{
  "id" : "e80c7088-6676-4b56-9aaf-30cfbe1a4367",
  "type" : "apache_log",
  "creationDate" : 804571706000,
  "fields" : {
    "src_ip" : "166.79.67.111",
    "record_id" : "e80c7088-6676-4b56-9aaf-30cfbe1a4367",
    "http_method" : "GET",
    "record_value" : "166.79.67.111 - - [01/Jul/1995:00:08:26 -0400] \"GET /images/NASA-logosmall.gif HTTP/1.0\" 200 786",
    "http_query" : "/images/NASA-logosmall.gif",
    "bytes_out" : "786",
    "identd" : "-",
    "http_version" : "HTTP/1.0",
    "http_status" : "200",
    "record_time" : 804571706000,
    "user" : "-",
    "record_type" : "apache_log"
  }
}
8. What’s going on behing the scene
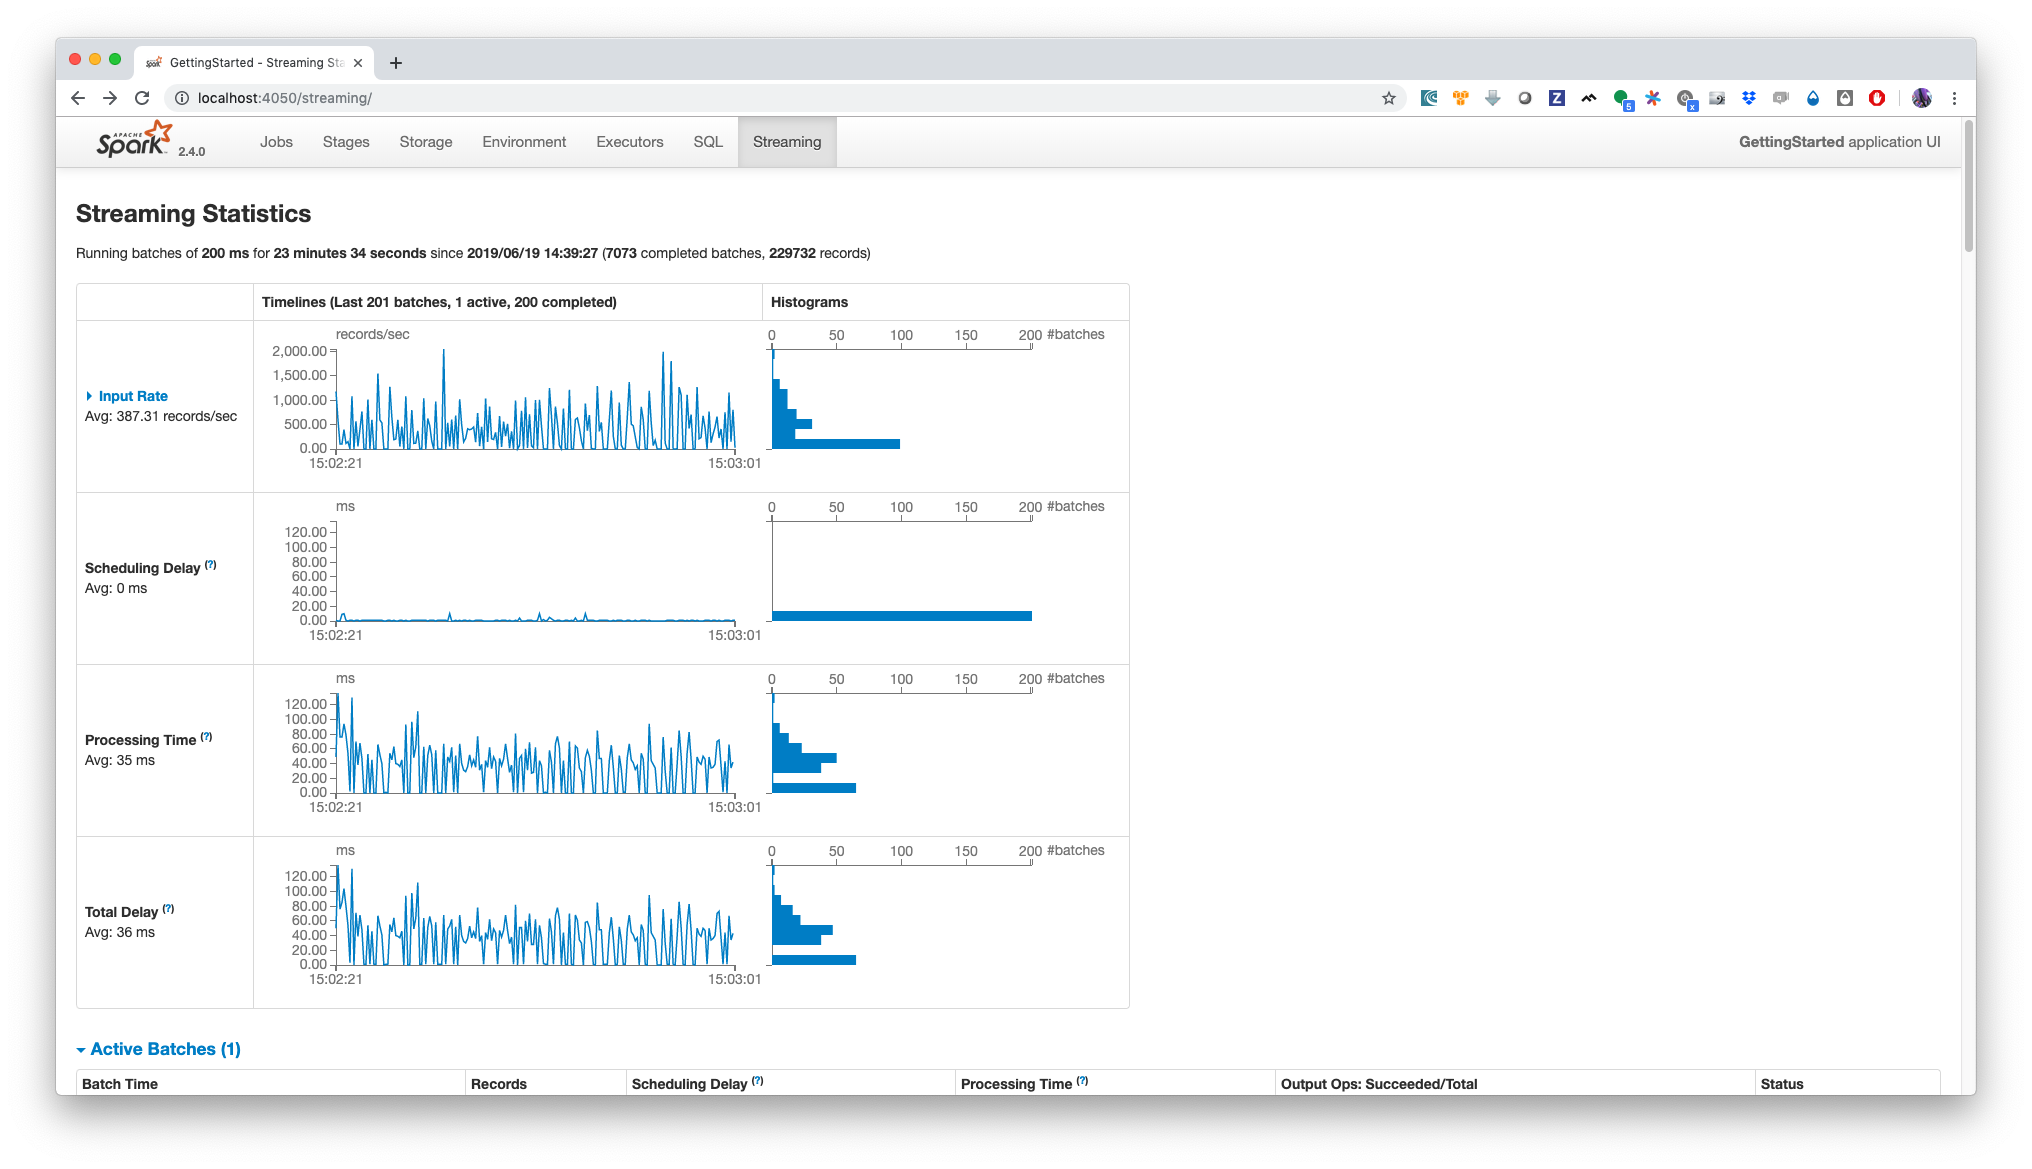
You should open the following url http://localhost:4050/streaming/ in your browser to get some metrics from spark streaming throughput.

The main metric here is the lag or scheduling delay, which one you want to be as low as possible (near zero) or at least no increasing constantly otherwise this would be a sign that you need to make your app scale, it can be by increasing the partitionning of Kafka topics and the number of cores that process simultaneously your data. This is a huge topic.
Another metric is processing time, which gives us some insights about the processing capabilities of our setup. This where the logisland scalabity can be viewed (add more kafka topics and spark processors and you’ll see how you can handle a more intense workload)
9. Stop the solution
Stop Zookeeper, Kafka, Loggen & Logisland container with the following command docker-compose down
10. What’s next?
This guide covered the creation of an application using Logisland. However, there is much more. We recommend continuing the journey with the event aggregation guide, where you learn about how to aggregate some metrics from your data.

