Logisland - Event Aggregation
Learn how to aggregate metrics over time window events This guide covers:
-
avro schema validation
-
event aggregation stream
1. Prerequisites
To complete this guide, you need:
-
less than 15 minutes
-
an IDE
-
JDK 1.8+ installed with
JAVA_HOMEconfigured appropriately -
Apache Maven 3.5.3+
-
The completed greeter application from the Getting Started Guide
2. Architecture
In this guide, we expand on the initial log parsing stream that was created as part of the Getting Started Guide. We cover how to generate time window metrics on some http traffic (apache log records).
3. Solution
We recommend that you follow the instructions in the next sections and create the application step by step. However, you can go right to the completed example.
Clone the Git repository: git clone https://github.com/hurence/logisland-quickstarts.git, or download an archive.
The solution is located in the conf/core/event-aggregation.yml file.
This guide assumes you already have the completed application from the getting-started guide.
4. Logisland job setup
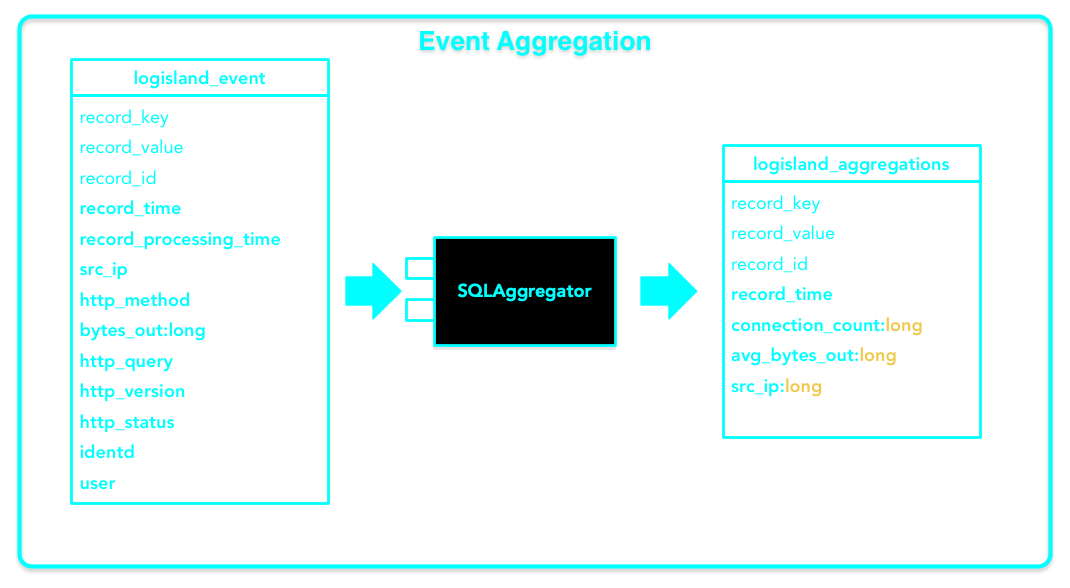
Our application will add a new stream to the previous one (Getting Started Guide) : the sql stream is a special one one use a KafkaRecordStreamSQLAggregator. This stream defines input/output topics names as well as Serializers, avro schema.
| The Avro schema is set for the input topic and must be same as the avro schema of the output topic for the stream that produces the records (please refer to Getting Started Guide) |
{
    "version":1,
    "type": "record",
    "name": "com.hurence.logisland.record.apache_log",
    "fields": [
        { "name": "record_errors",   "type": [ {"type": "array", "items": "string"},"null"] },
        { "name": "record_raw_key", "type": ["string","null"] },
        { "name": "record_raw_value", "type": ["string","null"] },
        { "name": "record_id",   "type": ["string"] },
        { "name": "record_time", "type": ["long"] },
        { "name": "record_type", "type": ["string"] },
        { "name": "src_ip",      "type": ["string","null"] },
        { "name": "http_method", "type": ["string","null"] },
        { "name": "bytes_out",   "type": ["long","null"] },
        { "name": "http_query",  "type": ["string","null"] },
        { "name": "http_version","type": ["string","null"] },
        { "name": "http_status", "type": ["string","null"] },
        { "name": "identd",      "type": ["string","null"] },
        { "name": "user",        "type": ["string","null"] }
    ]
}
The most important part of the KafkaRecordStreamSQLAggregator is its sql.query property which defines a query to apply on the incoming records for the given time window.
The following SQL query will be applied on sliding window of 10" of records.
SELECT count(*) AS connections_count,
       avg(bytes_out) AS avg_bytes_out,
       src_ip,
       first(record_time) as record_time
FROM logisland_events
GROUP BY src_ip
ORDER BY connections_count DESC
LIMIT 20
which will consider logisland_events topic as SQL table and create 20 output Record with the fields avg_bytes_out, src_ip & record_time. The statement with record_time will ensure that the created records will correspond to the effective input event time (not the actual time).
- stream: metrics_by_host
    component: com.hurence.logisland.stream.spark.KafkaRecordStreamSQLAggregator
    type: stream
    documentation: a processor that links
    configuration:
    kafka.input.topics: logisland_events
    kafka.output.topics: logisland_aggregations
    kafka.error.topics: logisland_errors
    kafka.input.topics.serializer: com.hurence.logisland.serializer.KryoSerializer
    kafka.output.topics.serializer: com.hurence.logisland.serializer.KryoSerializer
    kafka.error.topics.serializer: com.hurence.logisland.serializer.JsonSerializer
    kafka.metadata.broker.list: sandbox:9092
    kafka.zookeeper.quorum: sandbox:2181
    kafka.topic.autoCreate: true
    kafka.topic.default.partitions: 2
    kafka.topic.default.replicationFactor: 1
    window.duration: 10
    avro.input.schema: >
        {  "version":1,
            "type": "record",
            "name": "com.hurence.logisland.record.apache_log",
            "fields": [
            { "name": "record_errors",   "type": [ {"type": "array", "items": "string"},"null"] },
            { "name": "record_raw_key", "type": ["string","null"] },
            { "name": "record_raw_value", "type": ["string","null"] },
            { "name": "record_id",   "type": ["string"] },
            { "name": "record_time", "type": ["long"] },
            { "name": "record_type", "type": ["string"] },
            { "name": "src_ip",      "type": ["string","null"] },
            { "name": "http_method", "type": ["string","null"] },
            { "name": "bytes_out",   "type": ["long","null"] },
            { "name": "http_query",  "type": ["string","null"] },
            { "name": "http_version","type": ["string","null"] },
            { "name": "http_status", "type": ["string","null"] },
            { "name": "identd",      "type": ["string","null"] },
            { "name": "user",        "type": ["string","null"] }    ]}
    sql.query: >
        SELECT count(*) AS connections_count, avg(bytes_out) AS avg_bytes_out, src_ip
        FROM logisland_events
        GROUP BY src_ip
        ORDER BY event_count DESC
        LIMIT 20
    max.results.count: 1000
    output.record.type: top_client_metrics
Here we will compute every x seconds, the top twenty src_ip for connections count.
The result of the query will be pushed into to logisland_aggregations topic as new top_client_metrics Record containing connections_count and avg_bytes_out fields.
5. Launch the script
For this tutorial we will handle some apache logs with a splitText parser and send them to Elastiscearch Connect a shell to your logisland container to launch the following streaming jobs.
sudo docker exec -i -t logisland-quickstarts_logisland_1 bin/logisland.sh --conf conf/core/event-aggregation.yml
6. See what we have in return
Logisland will handle the parsing of the log lines and structure them as Records. Those will be sent in another Kafka topic.
sudo docker exec -ti logisland-quickstarts_kafka_1 /opt/kafka/bin/kafka-console-consumer.sh  \\
    --bootstrap-server kafka:9092 --topic logisland_aggregations
You should see the apache log events such as :
@TODO put here a sample aggregation output