Datastore Elasticsearch Guide
Learn how to send Logisland Records into Elasticsearch through de the Datastore API
This guide covers:
-
datastore API
-
Elasticsearch setup
1. Prerequisites
To complete this guide, you need:
-
less than 15 minutes
-
an IDE
-
JDK 1.8+ installed with
JAVA_HOMEconfigured appropriately -
Apache Maven 3.5.3+
-
The completed greeter application from the Getting Started Guide
2. Solution
We recommend that you follow the instructions in the next sections and create the application step by step. However, you can go right to the completed example.
Clone the Git repository: git clone https://github.com/hurence/logisland-quickstarts.git, or download an archive.
The solution is located in the conf/datastore/es-write.yml directory.
This guide assumes you already have the completed application from the getting-started directory.
3. Setup the environment
For this guide we need a Logisland stack (Zookeeper, Kafka, Logisland) and an Elasticsearch/Kibana combo as a complete Docker compose config.
| Please note that you should not launch silmutaneously several docker-compose because we are exposing local port in them. So running several at the same time would be conflicting. So be sure to have killed all your previously launched (Logisland) containers. |
Launch your docker containers with this command :
sudo docker-compose -f docker-compose.yml -f docker-compose-datastore-es.yml up -d
Make sure all containers are running and that there is no error.
sudo docker-compose ps
Those containers should now be up and running as shown below
CONTAINER ID        IMAGE                                                 COMMAND                  CREATED             STATUS              PORTS                                                                    NAMES
0d9e02b22c38        docker.elastic.co/kibana/kibana:5.4.0                 "/bin/sh -c /usr/loc…"   13 seconds ago      Up 8 seconds        0.0.0.0:5601->5601/tcp                                                   conf_kibana_1
ab15f4b5198c        docker.elastic.co/elasticsearch/elasticsearch:6.6.2   "/bin/bash bin/es-do…"   13 seconds ago      Up 7 seconds        0.0.0.0:9200->9200/tcp, 0.0.0.0:9300->9300/tcp                           conf_elasticsearch_1
a697e45d2d1a        hurence/logisland:1.1.0                               "tail -f bin/logisla…"   13 seconds ago      Up 9 seconds        0.0.0.0:4050->4050/tcp, 0.0.0.0:8082->8082/tcp, 0.0.0.0:9999->9999/tcp   conf_logisland_1
db80cdf23b45        hurence/zookeeper                                     "/bin/sh -c '/usr/sb…"   13 seconds ago      Up 10 seconds       2888/tcp, 3888/tcp, 0.0.0.0:2181->2181/tcp, 7072/tcp                     conf_zookeeper_1
7aa7a87dd16b        hurence/kafka:0.10.2.2-scala-2.11                     "start-kafka.sh"         13 seconds ago      Up 5 seconds        0.0.0.0:9092->9092/tcp                                                   conf_kafka_1
4. Logisland job setup
Now that we have a fully functionnal infrastructure, we can go to the stream processing job definition.
The beginning of the job remains the same as the Getting Started one :
-
an
Enginedefinition -
a
RecordStreamto handle the processing pipeline -
a sequence of
Processorto parse the logs
What is new here is the
-
controllerServicedefinition to instanciate an Elasticsearch Datastore -
a
BulkPutprocessor to sendRecordsto the DataStore
The controllerServiceConfigurations part is here to define all services that be shared by processors within the whole job, here an Elasticsearch service that will be used later in the BulkAddElasticsearch processor.
engine:
  component: com.hurence.logisland.engine.spark.KafkaStreamProcessingEngine
  configuration:
    spark.app.name: IndexApacheLogsDemo
    spark.master: local[2]
  controllerServiceConfigurations:

    - controllerService: datastore_service
      component: com.hurence.logisland.service.elasticsearch.Elasticsearch_6_6_2_ClientService
      configuration:
        hosts: elasticsearch:9300
        cluster.name: es-logisland
        batch.size: 500
As you can see it uses environment variable so make sure to set them. (if you use the docker-compose file of this tutorial it is already done for you).
You should notice that elasticsearch_service is the unique name given to the ControllerService which can referenced by any Processor config further in the config file.
Inside this engine you will run a Kafka stream of processing, so we setup input/output topics and Kafka/Zookeeper hosts.
Here the stream will read all the logs sent in logisland_raw topic and push the processing output into logisland_events topic.
- processor: apache_parser
    component: com.hurence.logisland.processor.SplitText
        ...

- processor: es_publisher
    component: com.hurence.logisland.processor.elasticsearch.BulkAddElasticsearch
    configuration:
        elasticsearch.client.service: elasticsearch_service
        default.index: logisland
        default.type: event
        timebased.index: yesterday
        es.index.field: search_index
        es.type.field: record_type
you can now run the job inside the logisland container
sudo docker exec -ti logisland-quickstarts_logisland_1 ./bin/logisland.sh --conf ./conf/datastore/es-write.yml
5. Inspect the logs
5.1. Kibana
With ElasticSearch, you can use Kibana. We included one in our docker-compose file.
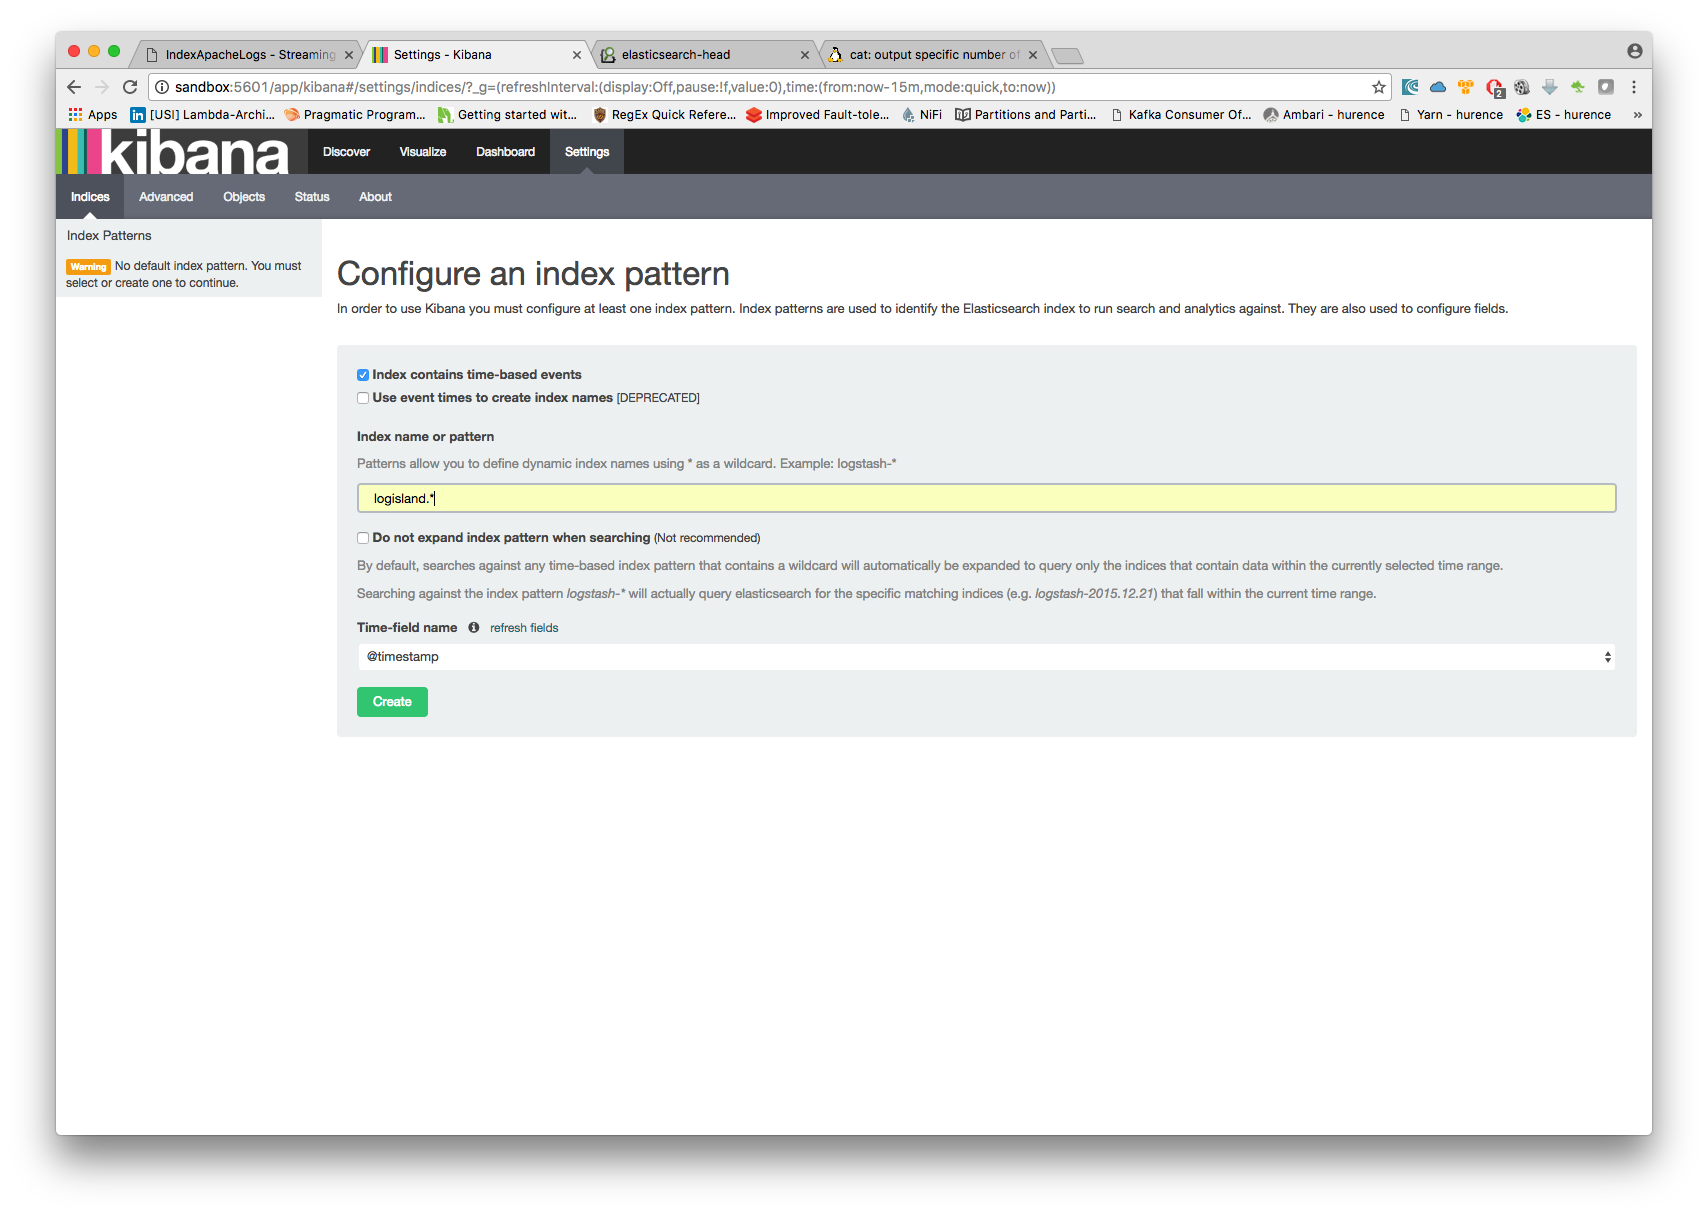
Open up your browser and go to http://localhost:5601/ and you should be able to explore your apache logs.
Configure a new index pattern with logisland.* as the pattern name and @timestamp as the time value field.
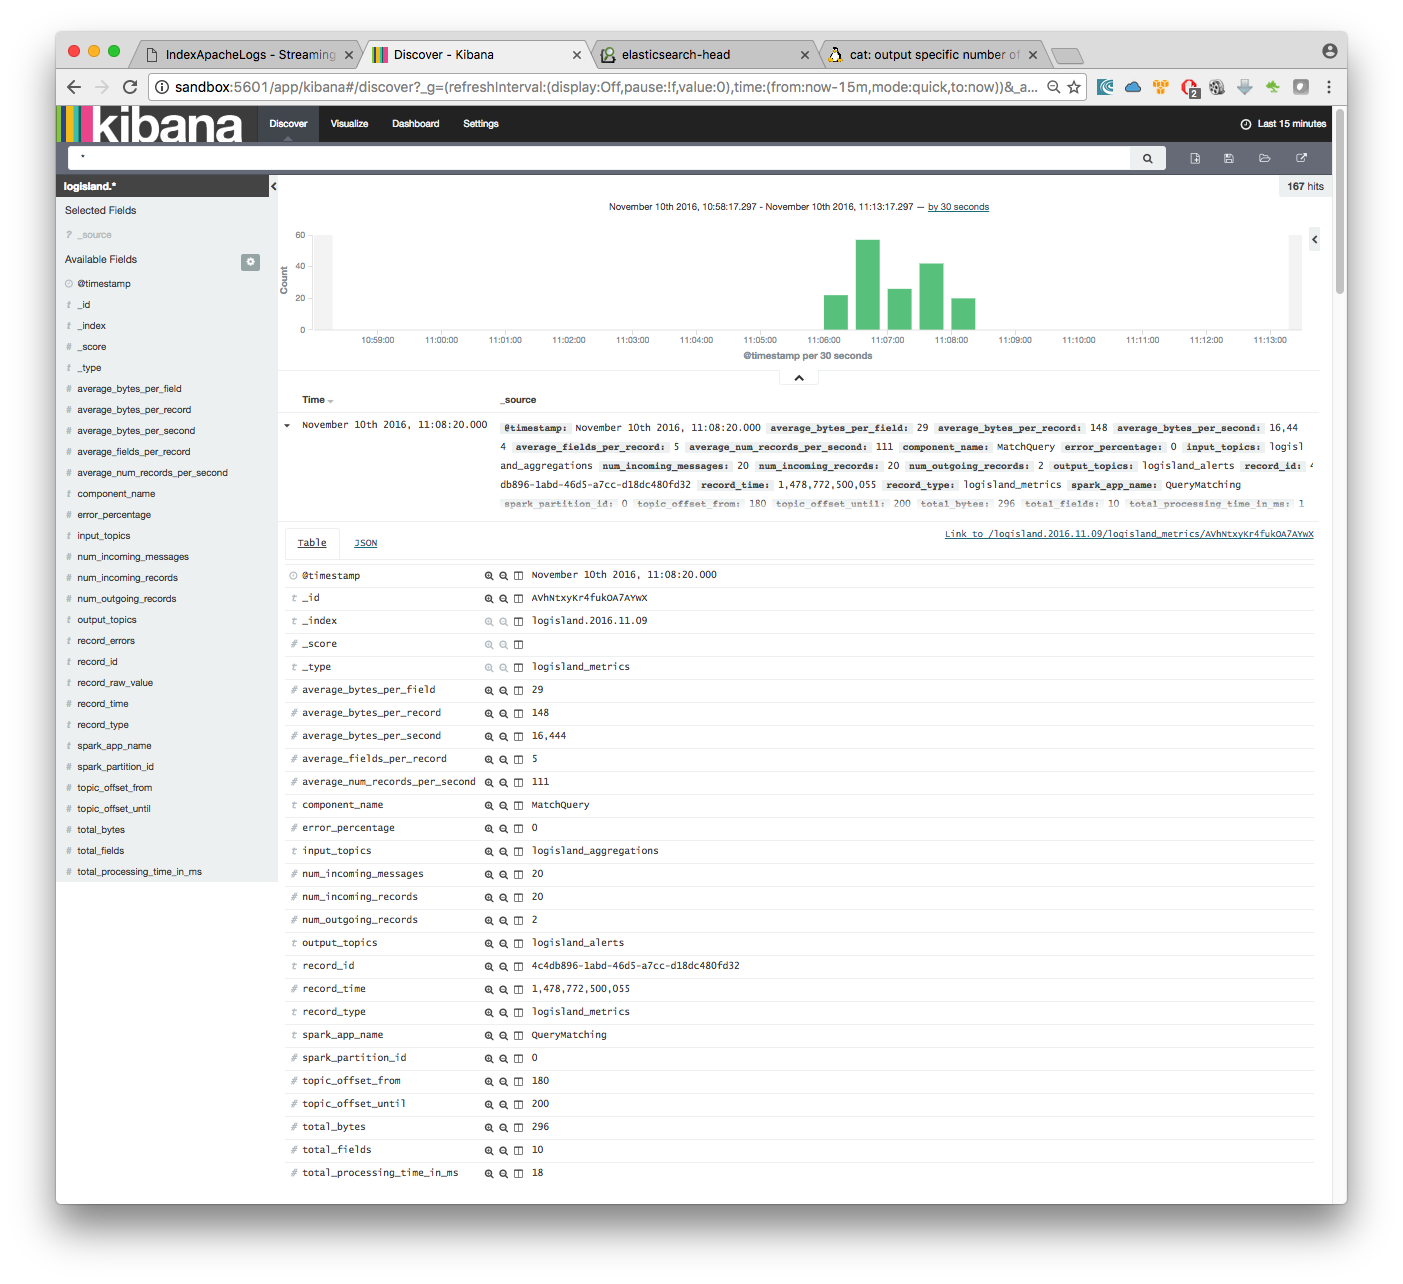
Then if you go to Explore panel for the latest 15' time window you’ll only see logisland process_metrics events which give you insights about the processing bandwidth of your streams.
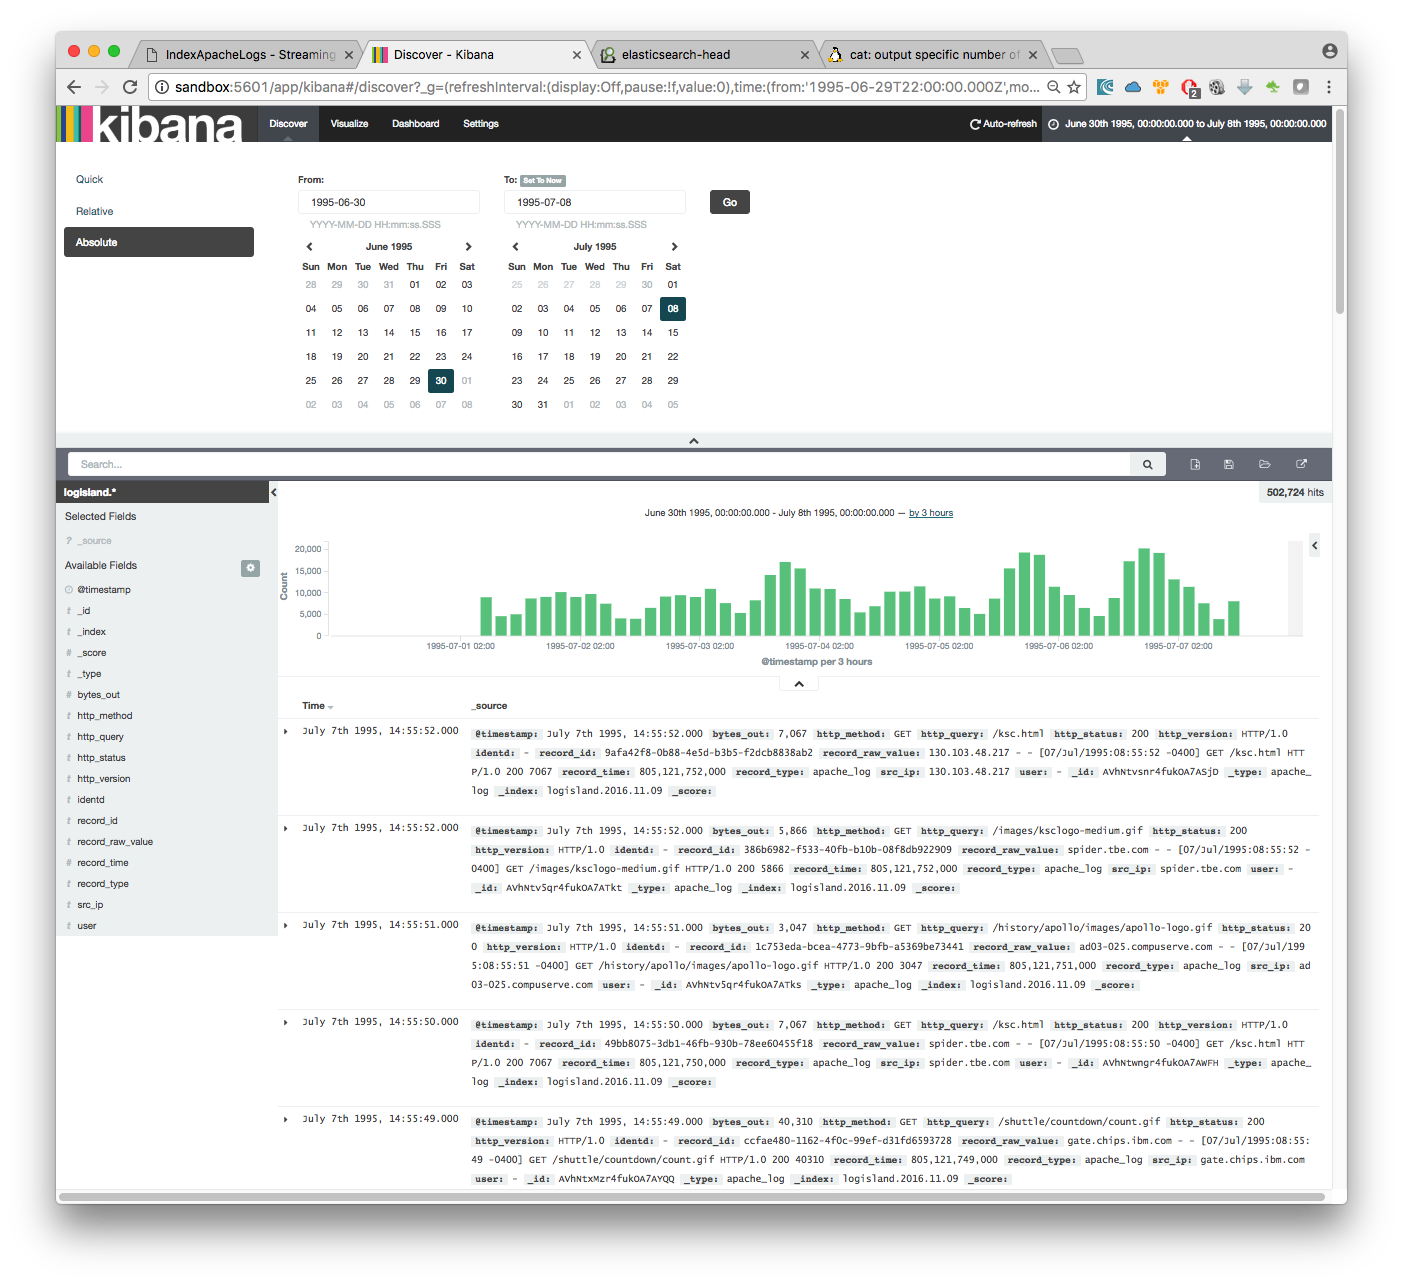
As we explore data logs from july 1995 we’ll have to select an absolute time filter from 1995-06-30 to 1995-07-08 to see the events.
6. Stop the job
You can Ctr+c the console where you launched logisland job. Then to kill all containers used run :
sudo docker-compose down
Make sure all container have disappeared.
sudo docker ps